Scouting Combine drills that matter for NFL success: Offensive positions
Looking back at 15-plus years of combine results to sort out what drills and measurements are most correlated with NFL success
The degree of importance of NFL Combine drills and measurements depends on what you’re looking to predict: draft position or actual player value. The former is known for all historical draft picks; the latter more estimation and shared understanding. I’ve attempt to push forward our understanding of non-quarterback player value with the NFL Plus/Minus metric, a universal, points-based measure.
The relationship between draft position and NFL value is fairly strong, but contrasting the two gives additional insight into systemic errors in over/underweighting certain traits and how teams can more productively harness information gathered at the combine.
METHODOLOGY
This analysis is built on strong work from former Harvard Sports Analysis Collective member Bill Lotter in his series detailing why the NFL Combine actually matters. Lotter used ridge regression to estimate the coefficients for the different Combine results and measure their importance in explaining prospects’ draft positions and value — the latter estimated using Pro Football Reference’s approximate value (AV) over players’ first three seasons.
Approximate value was a tremendous advancement in player valuation and the best public metric available to Lotter at the time of the analysis. The shortcomings of AV mostly relate to its focus on volume and the inability to differentiate between players on the same team for certain position groups that lack traditional stats, such as offensive linemen. Even for position groups with more extensive traditional stats such as tackles and sacks, their production can be more a function of luck and opportunity than adding value. This is where NFL Plus/Minus can truly add the proper context and weighting to the performance of each player. For my analysis, I’m contrasting Plus/Minus to draft position, in substitution of AV.
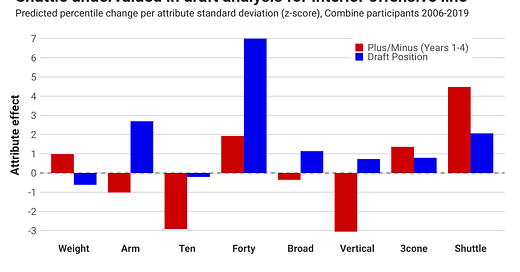
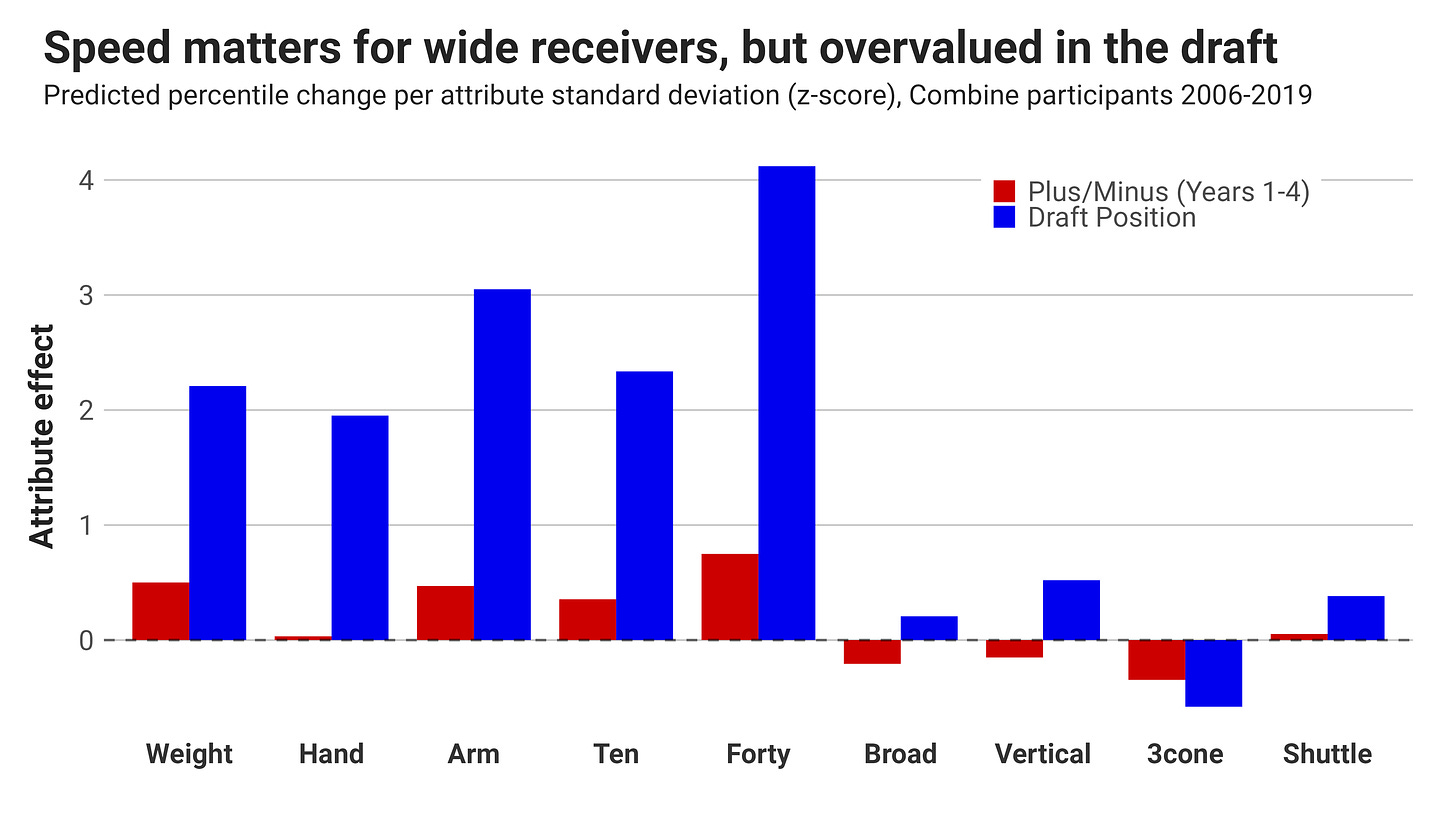
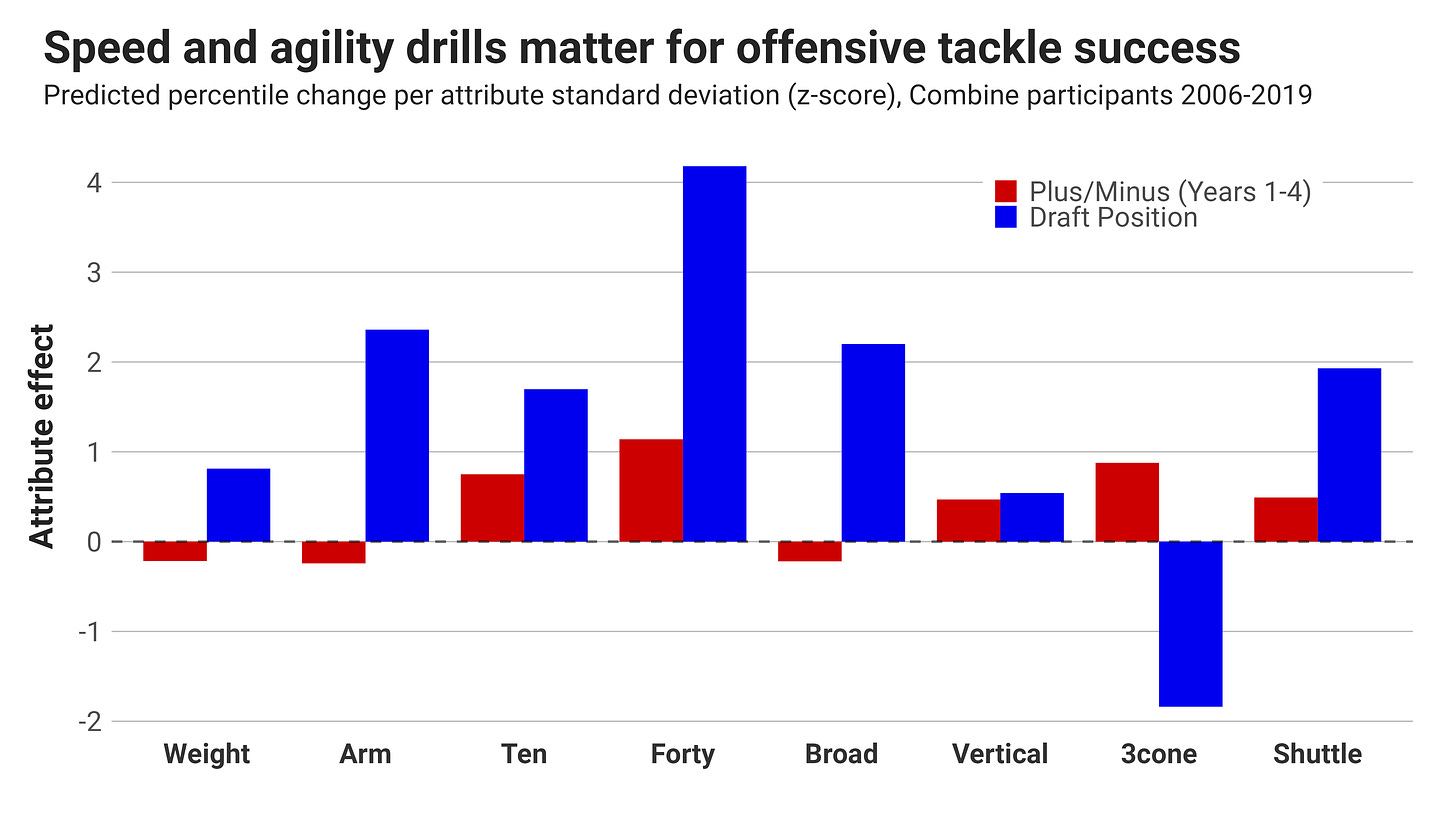
The plots below give the coefficient for each measurement or drill denominated by standard deviation within the position group. The draft positions and Plus/Minus for position groups are translated to percentile, giving both the same scale. Each bar below represents the amount of percentile movement you’d expect for a player with one standard deviation above or below the positional average.
The sample for this analysis covers all players who participated in all drills or all but one drill from 2006 to 2019. For players who missed a drill, the value was estimated through a regression on the remaining variables, with a discount applied to the result because of an assumption that the drill was purposely skipped with an expectation of underperformance. Players who participated in the combine and were not drafted are included in the sample with an assumed draft position of 300.
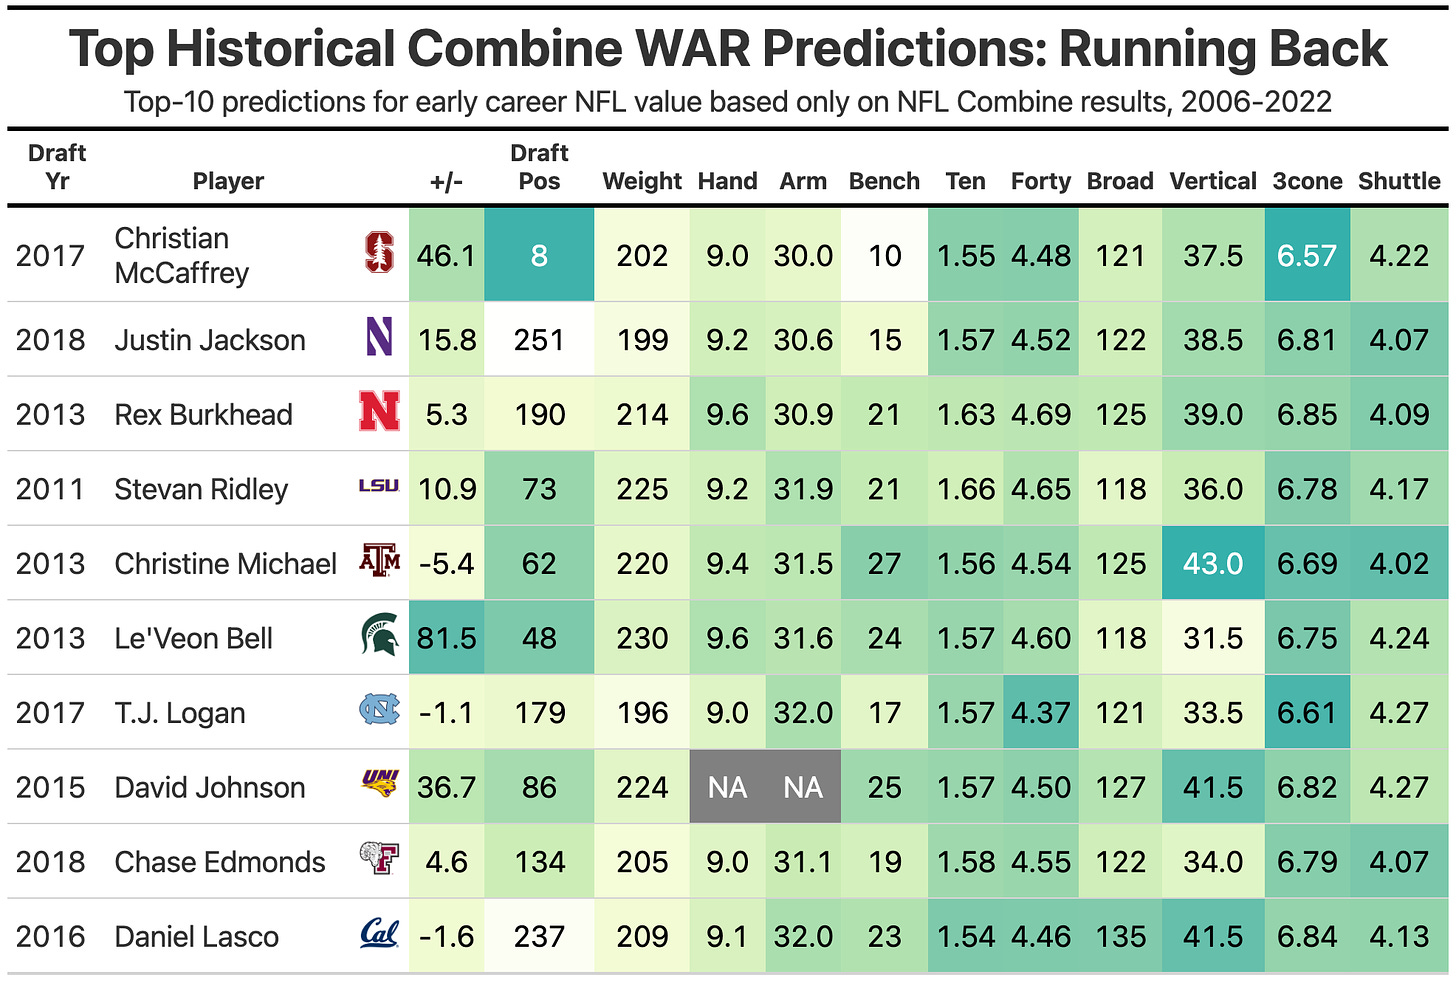
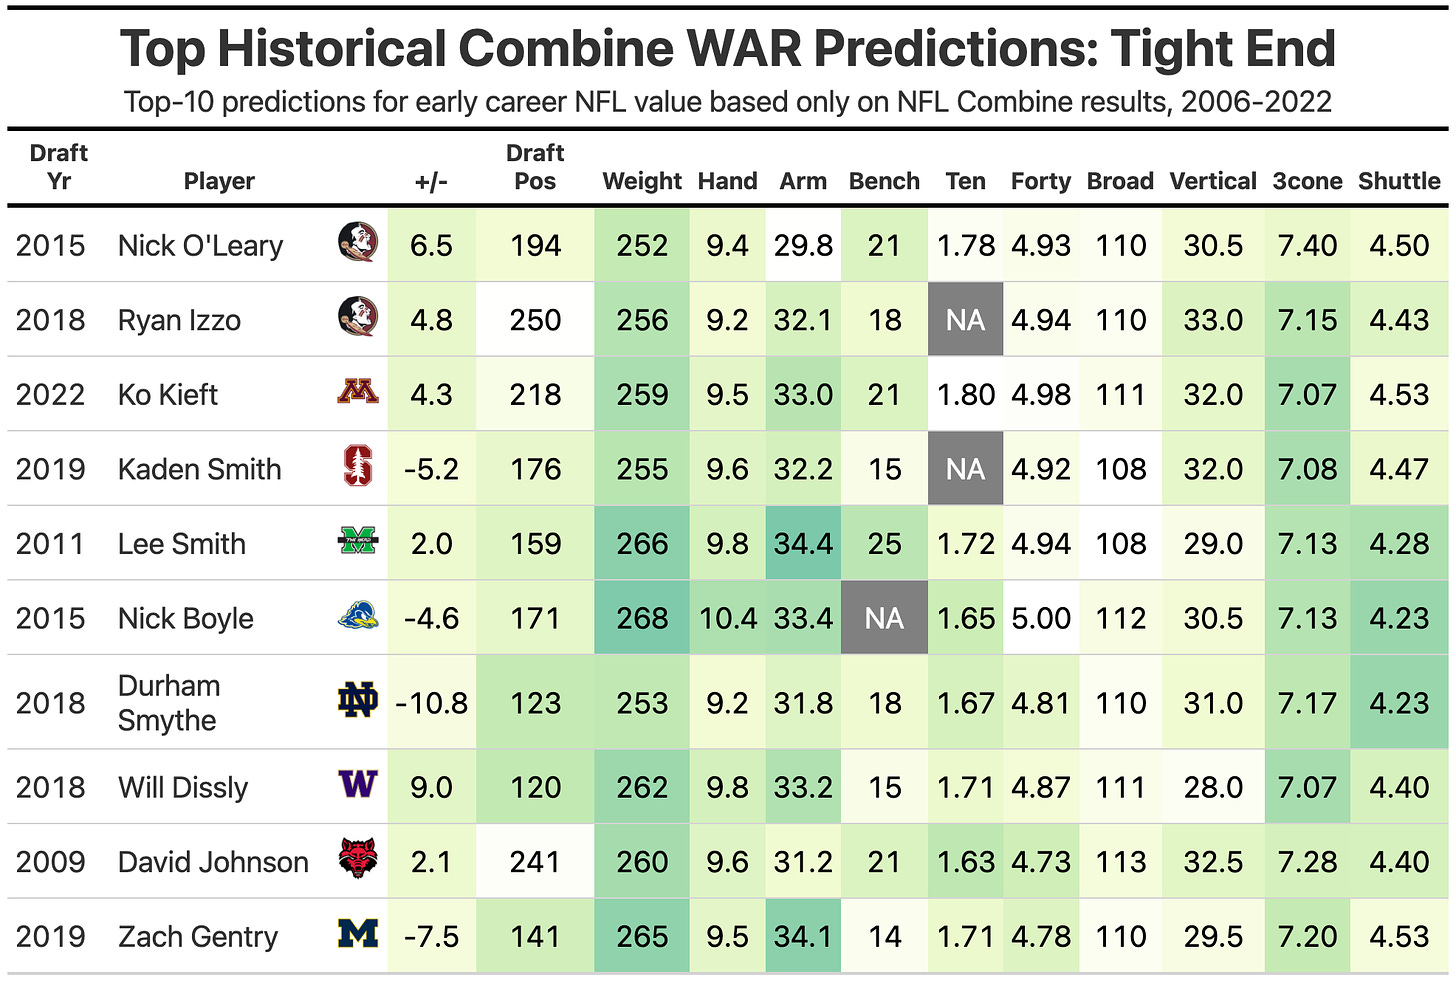
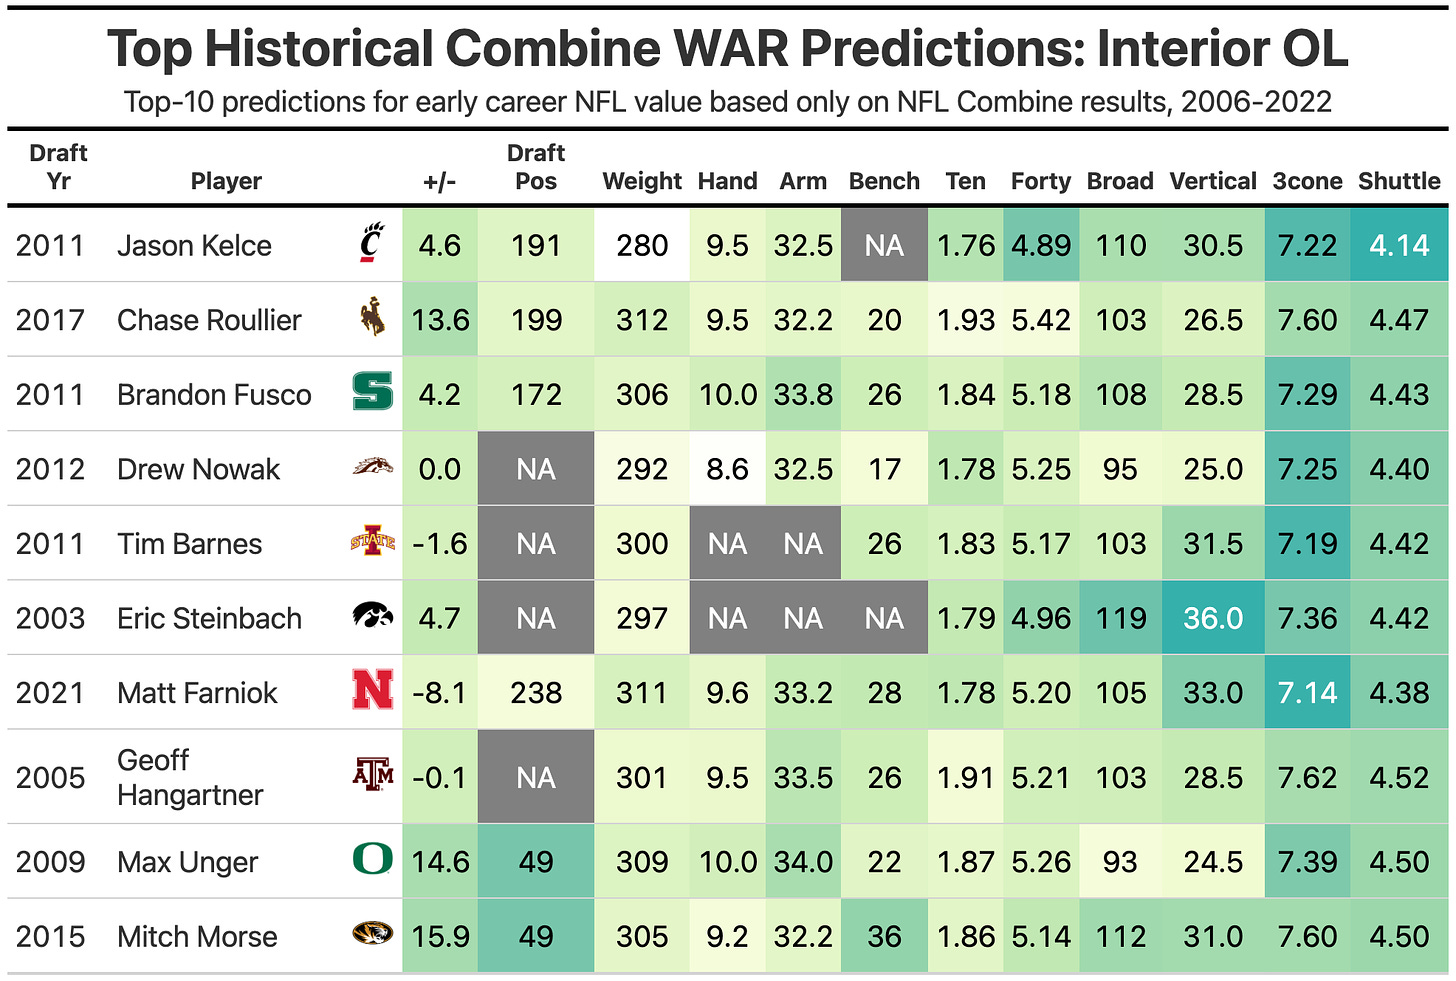
Below each plot, I’ve included a table with the top-10 projections for positional Plus/Minus (first four seasons) in the 2006 to 2022 period, including the players’ combine marks and their actual Plus/Minus produced.
RUNNING BACK
Generally, athletic testing has a much bigger effect on draft position than NFL value in the form of Plus/Minus. In fact, weight and speed have only a slightly negative correlation to NFL value, but a huge affect on draft position. Running back prospect three-cone times have almost equal correlations with draft position and actual value, making it the most important drill for teams to pay attention to for a relative advantage on the field.
Some of the most successful early career running backs in the sample fall onto the list of top combine performances. Christian McCaffrey, Le’Veon Bell and David Johnson all were seen as being at the top of NFL among running backs shortly after entering the league. You can see how the three-cone drill drives the top-10 results, with none of the running backs posting times over seven seconds.
WIDE RECEIVER
Big, tall wide receivers are coveted in the draft, and those are also attributes that drive actual NFL success according to Plus/Minus, but not nearly to the same degree. You will see a handful of receiver rise and fall significantly on draft boards over the next few weeks as measurements and drill times come in, but you don’t want to overreact.
For every top athlete at wide receiver who looks like he belongs in the NFL, there are at least two who never work out. Whether you end up with D.K. Metcalf or Chris Conley is more about the skills and profile of the prospect outside of their blazing forty times.
TIGHT END
Size, and to a lesser degree speed, are the driving attributes for NFL success at tight end. You wouldn’t think of size being terribly important when thinking about the smaller tight ends that are features in the passing game. I broke out the attribute correlations for tight ends targeting run-blocking and pass-catching value separately, and size is entirely related to the former. The reality for tight end is that much of the value in the receiving game is a crapshoot, and blocking value is more easily linked to size.
Most of the tight ends in the top-10 projections added some value in their early NFL career, but almost entire as run blockers.
OFFENSIVE TACKLE
More and more the NFL is looking for athleticism at the tackle position, at least according to the drills at the combine. The correlations between forty times and draft positions for tackles is nearly as strong as for wide receivers and running backs. The 20-yard shuttle and three-cone are also important for NFL success.
INTERIOR OFFENSIVE LINE
The signal for the 20-yard short shuttle is probably the strongest for interior offensive line than at any position and for any drill. Some other smart observers have been pointing to the shuttle as a key to offensive line success, and my modeling agrees.


