


Positional draft value rising for NFL pass catchers
Updated version of my position surplus value draft curves shows rising value for early round wide receivers and tight ends

The last few years have seen huge increases in the contract values for lots of positions, with the NFL salary cap skyrocketing nearly 25% over only the last two seasons. This means that the money NFL teams are spending on contracts across are going up on all positions, though some more than others. What matters in a hard-cap league1 is the relative amount spent on each position, as everyone is trying to maximize their roster player value under the same cap constraints.
Traditional draft value charts show a blended average of expected player value by selection number, calculating surplus value by subtracting the fixed rookie contract costs. The player value numbers come from what equivalent players drafted in that position go on to make on their second contracts, giving teams the value of a “discount” with artificially lowered rookie contracts.
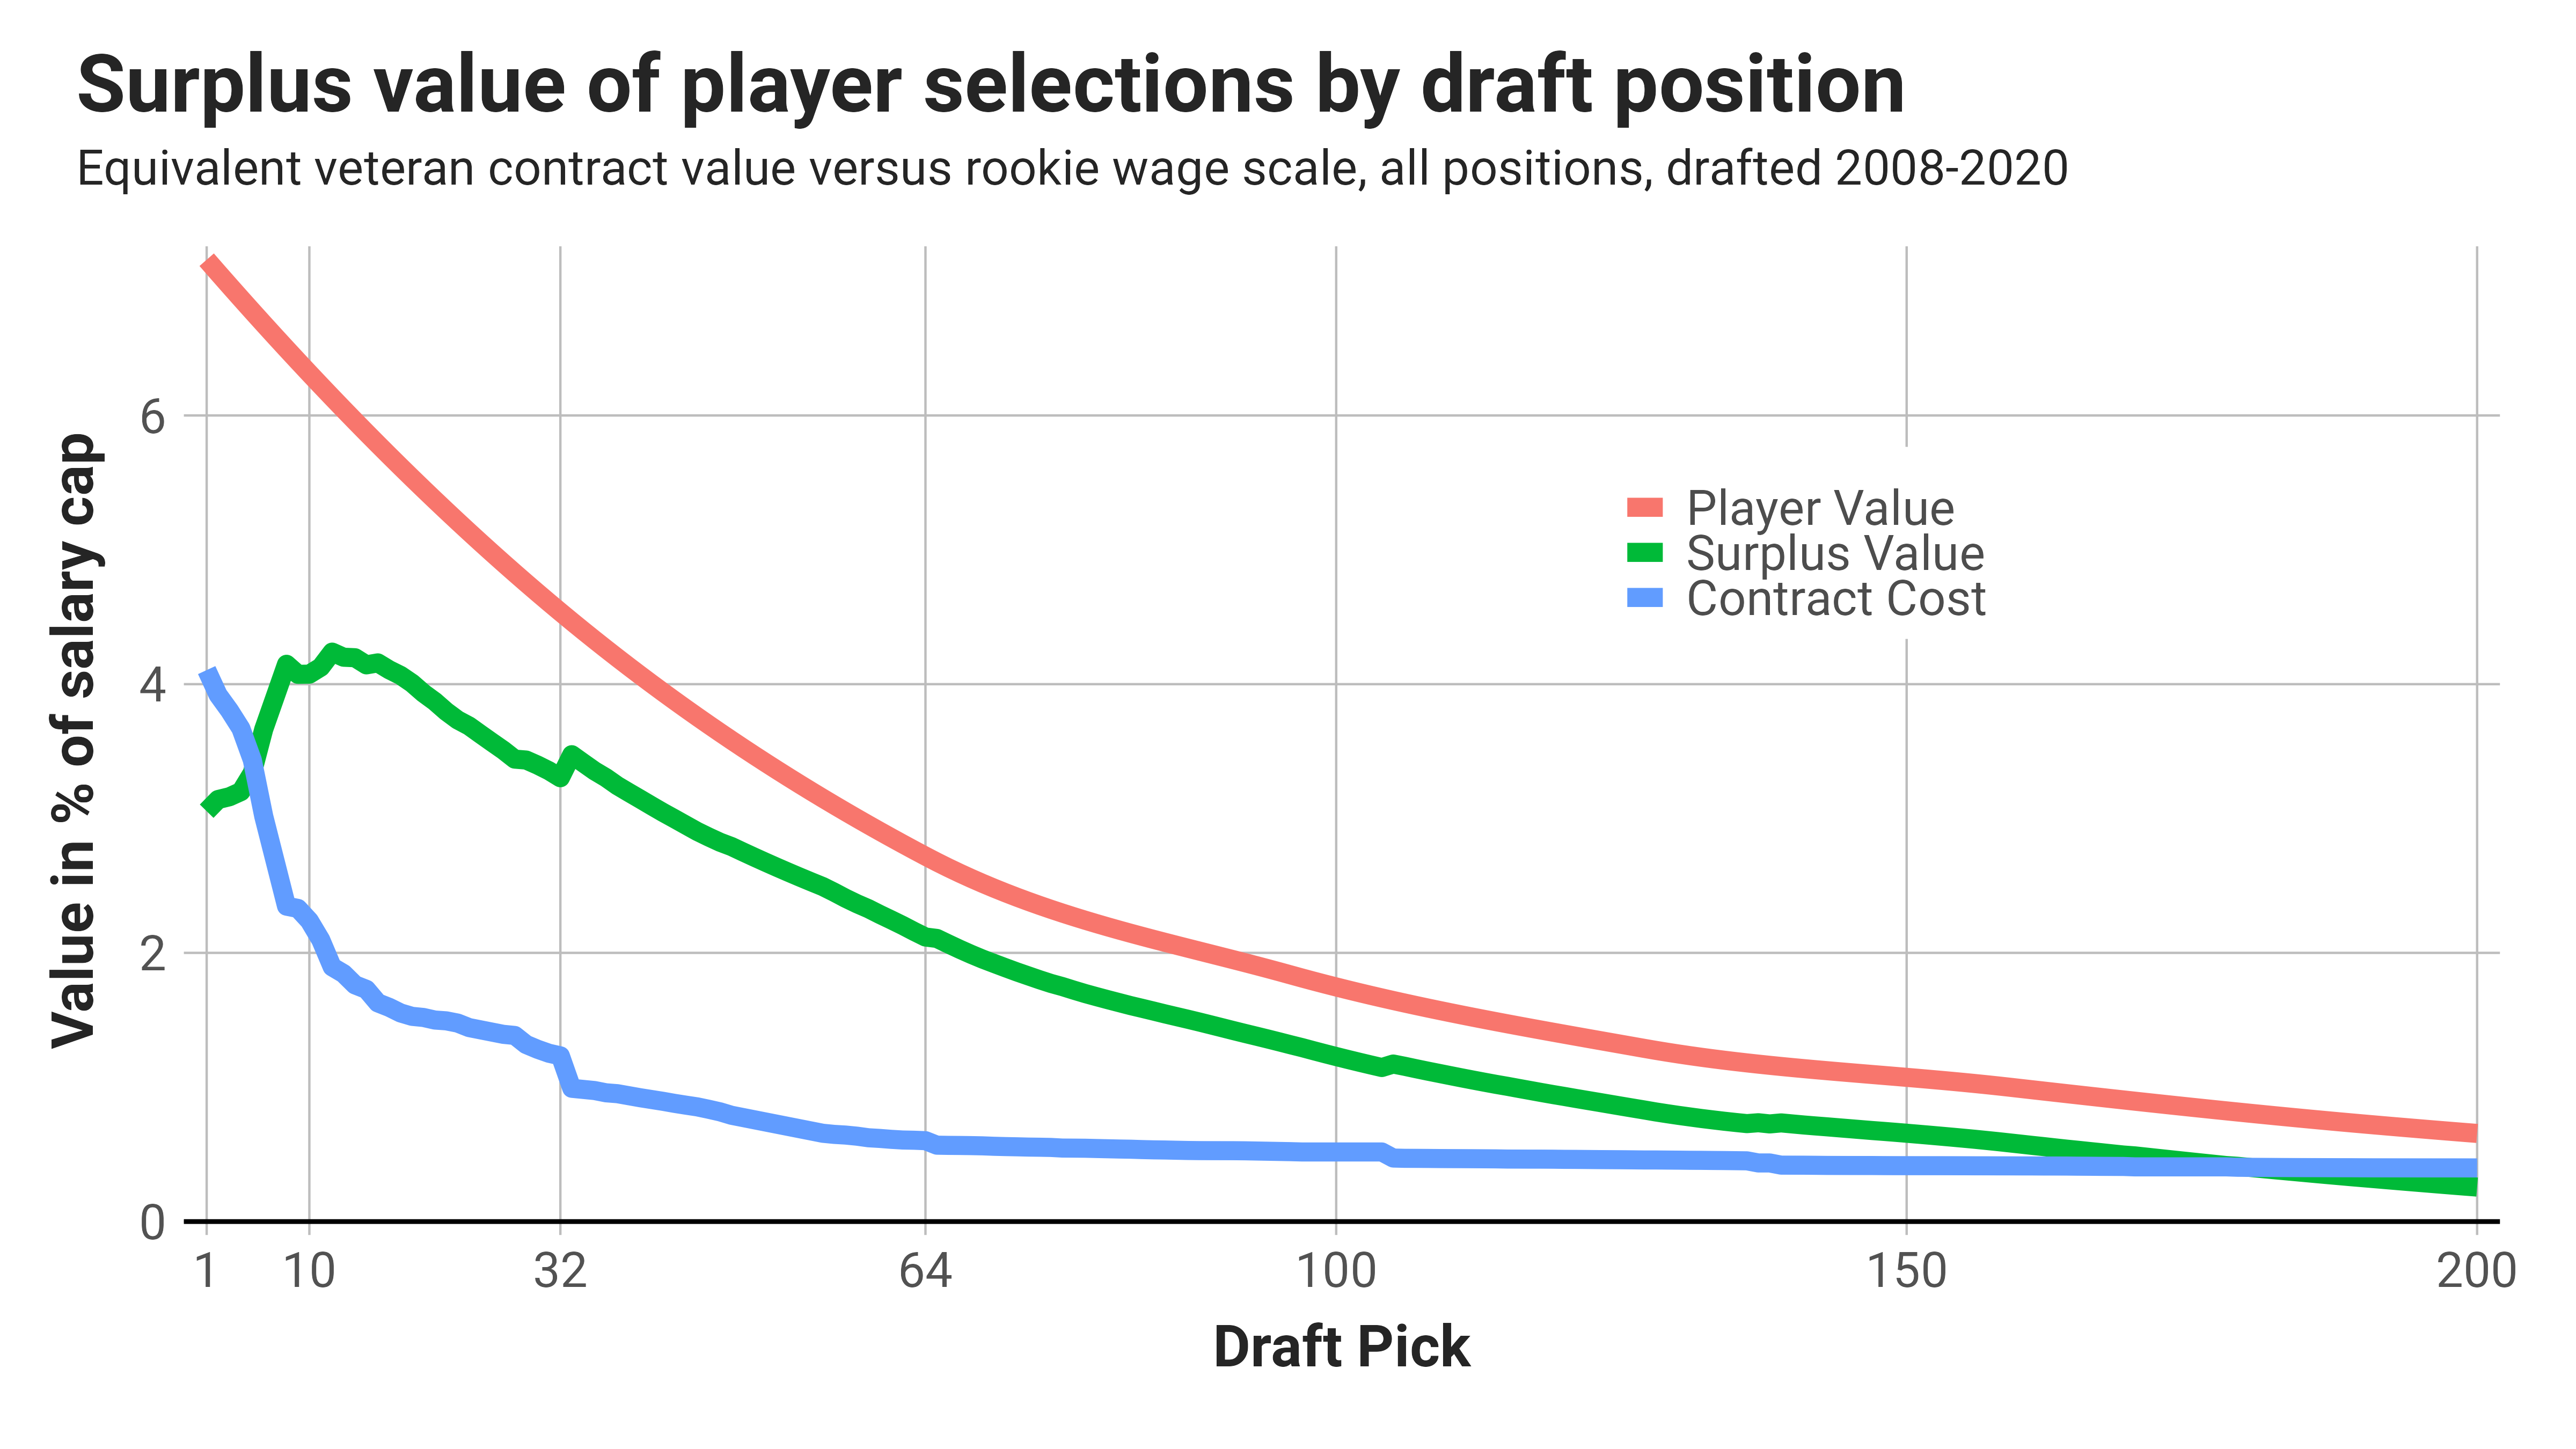
This all-positions-in-one chart has great value in appreciating how rapidly decreasing rookie contract costs can make lower drafted players, on average, more valuable than those taken earlier. Yes, players drafted in the top-5 picks are more valuable on the field than those taken later, but they also cost significantly more by fixed contract costs. That cost increase for top drafted players more than offsets the benefit, leading to the analytical heuristic ideas that trading back always brings value.
A couple years back, I broke down the draft value curve further into positional value, finding that not all are created equal. Sure, we know that the higher contract costs for top-notch quarterbacks should be ignored and we can take them high in the draft, but what about other positions?
What analytical draft value curves are missing about NFL roster building

Every draft post-mortem includes a battle between various fan bases and the nerds on whether their favorite team’s general manager made the appropriate cost-benefit decision or was fooled by overconfidence. It’s the classic battle of conventional wisdom and institutional authority versus outsiders with advanced tools of modeling and valuation. While the…
When I broke down the surplus value curves by position, a clear separation of value was revealed. This separation is caused by two general factors: the differentials in veteran contract costs for different positions, and, importantly, the historical availability of finding elite talent by positions in different rounds of the NFL draft. I was able to tier different non-quarterback positions by their surplus value curve similarities, showing the generally preferred options for which positions to target as the NFL draft moves along.
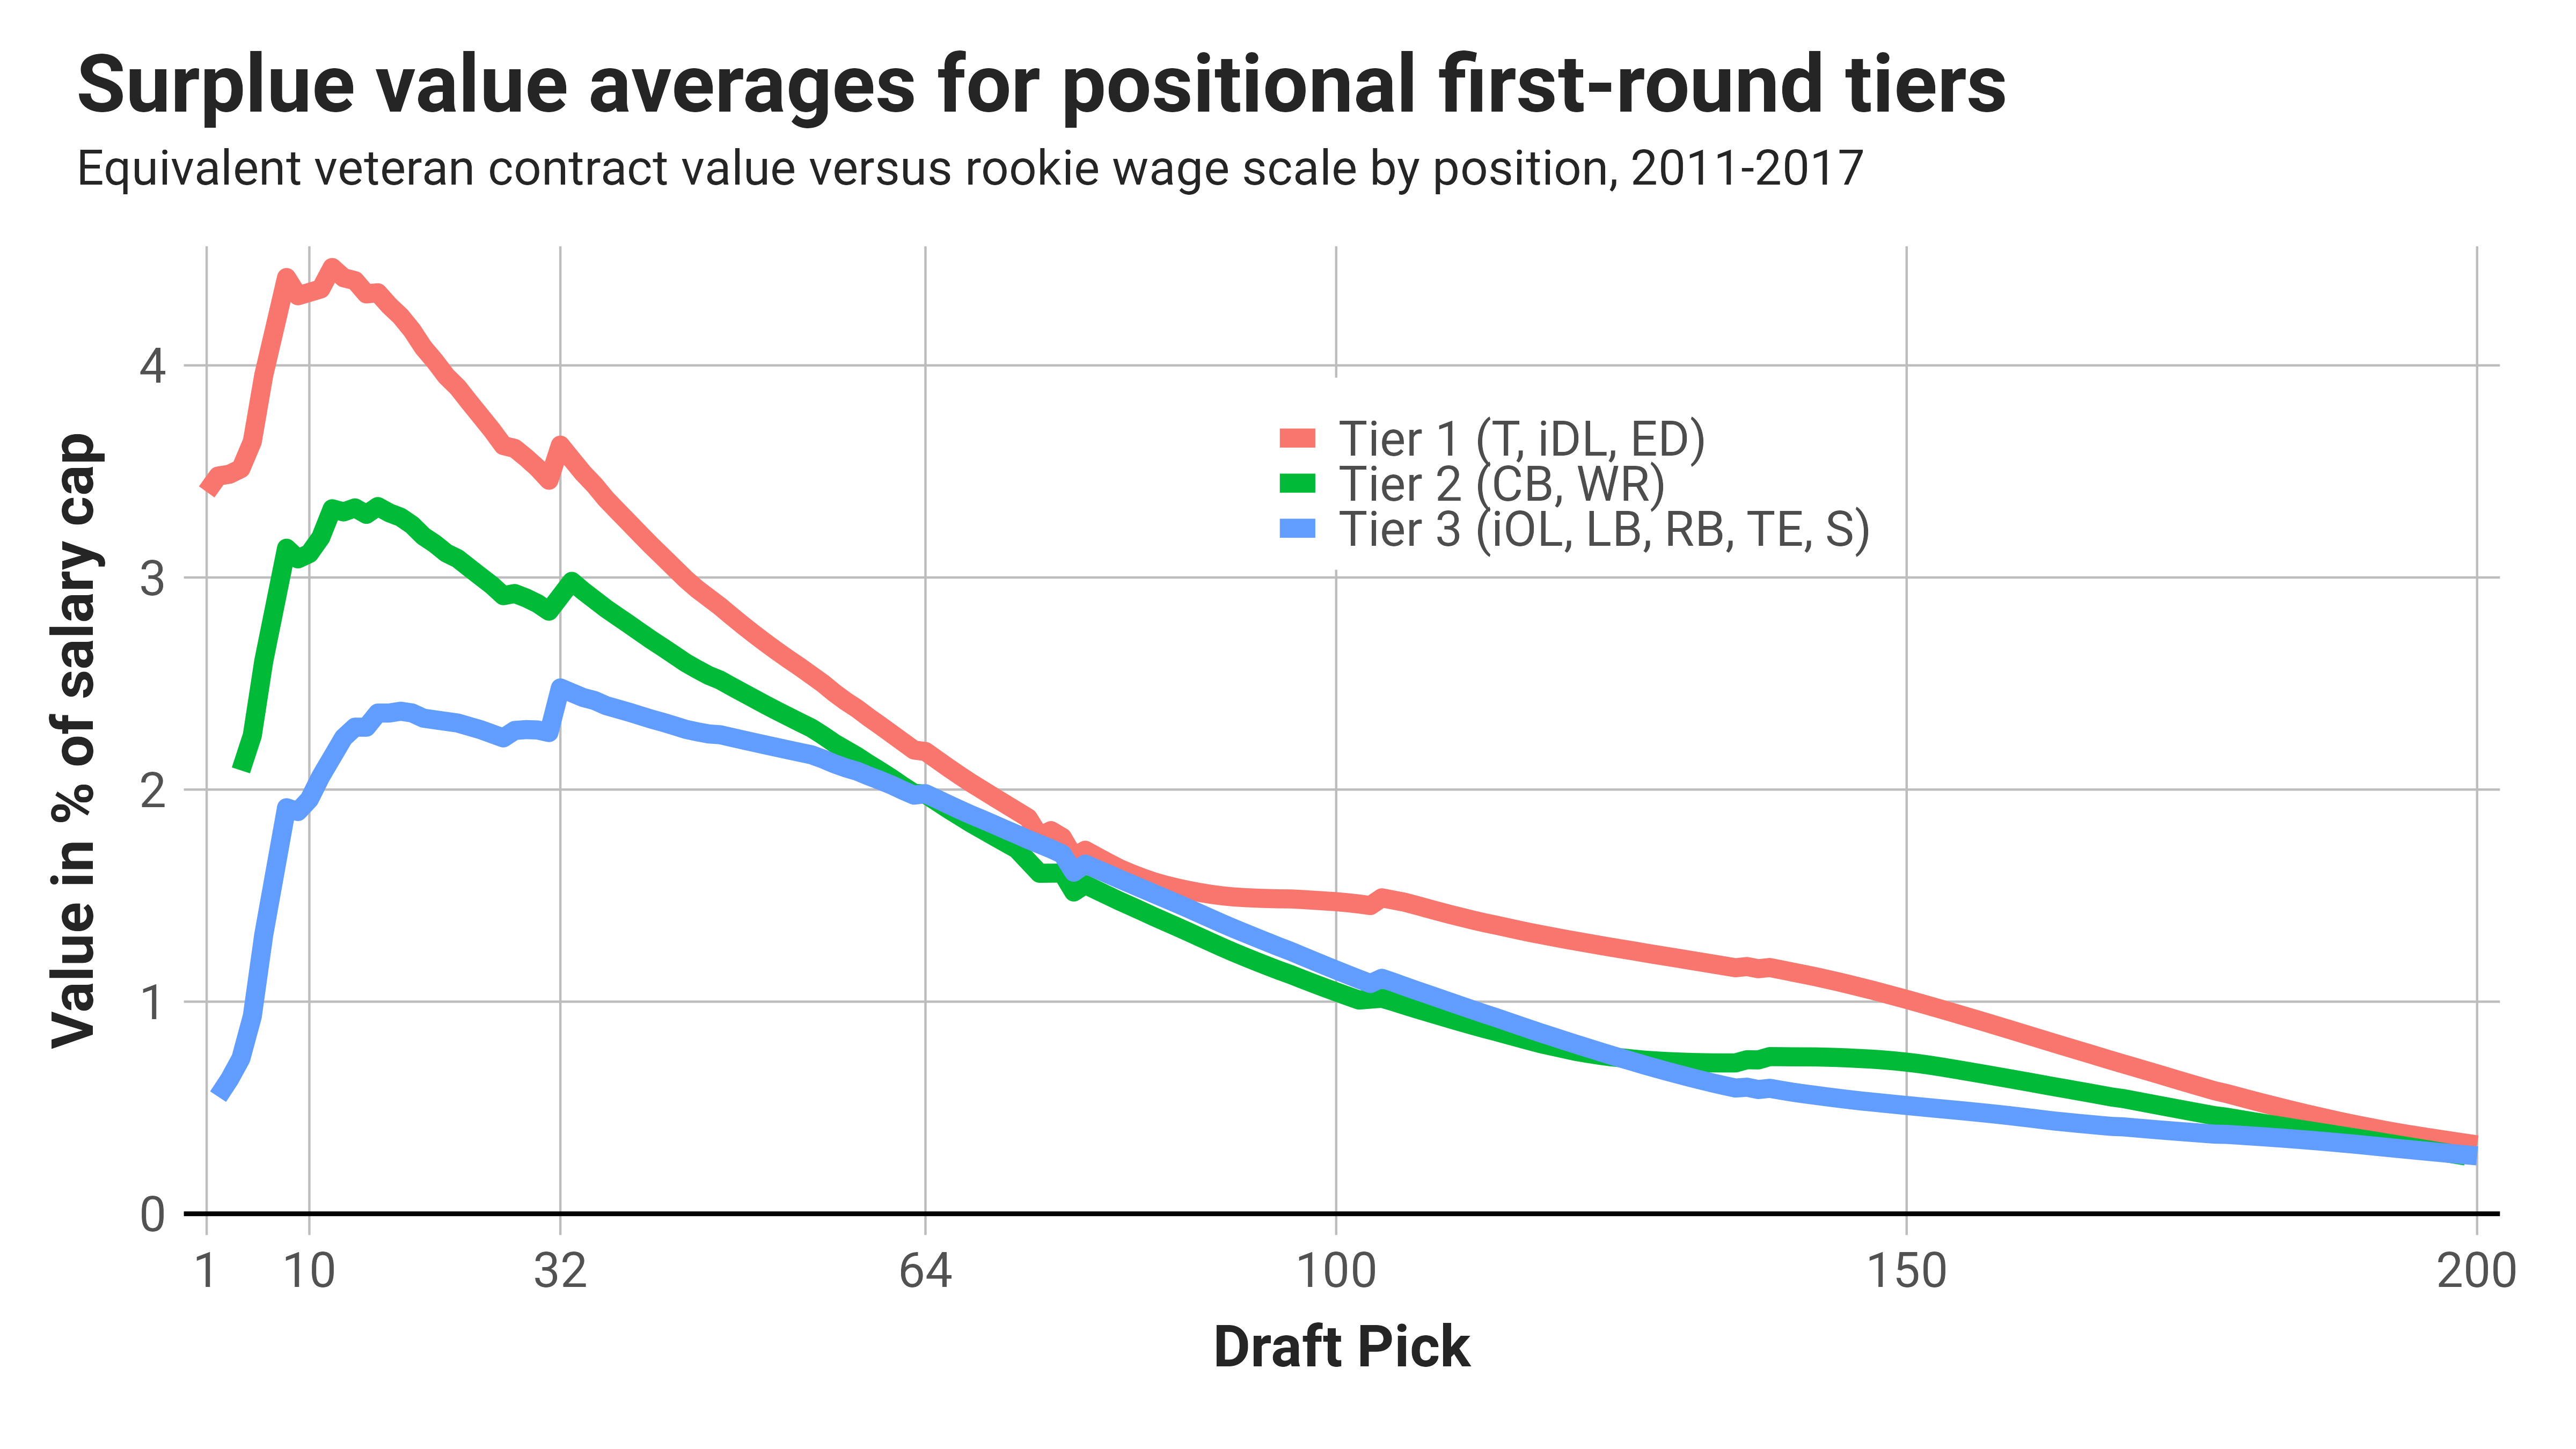
This is what that tiering looked like a few years back, but now we have updated data. In this analysis I’ll walk through how contracts signed in the last few offseasons have shifted the positional value landscape, and give us a new perspective on approaching the upcoming NFL draft.
Keep reading with a 7-day free trial
Subscribe to Unexpected Points to keep reading this post and get 7 days of free access to the full post archives.