NFC Offseason Grades: Free Agency and Trade Value Added
Projecting acquired player value for 2023 versus expectations based on contract APY
Since the league year officially began two weeks ago, we’ve seen hundreds of releases, free-agent signings and trades that will substantially alter the results of the 2023 NFL season. Even before free agents were officially able to sign new contracts, deals had been informally announced, and a handful of trades had be agreed to in principle.
I’ve been tracking and estimating the collective effect of all of these moves with the Unexpected Points Improvement Index, deriving a points-based measure of gains and losses for every team versus their rosters at the end of the 2022 season. As of now, the Chicago Bears and Houston Texans are projected add the most in point differential this season, and the Philadelphia Eagles having lost the most. The gains and losses are, obviously, a reflection on the baseline for how good or bad a team was coming into the offseason, and how much free cap space they had to invest.
Just because teams spent a lot, and improved the most off of a lower base projection, it doesn’t mean the spending was done wisely. In fact, the more you have to spend and the more needs you have, the easier it can be to overspend in free agency, the market where contracts have the highest premiums to player production.
In this analysis, beginning with NFC teams, I’m going to look more into how wisely teams spent there free agent dollar and trade capital the offseason from a cost-benefit standpoint. The cost for each acquisition is the player’s contract APY, with a premium added to account for surplus value1 lost in the case of players who were acquired via trades. For this analysis, I’m excluding quarterback additions, but will comment on them in the blurbs for each division.
The benefit side is my projections for value added over replacement level next season for each acquired player. The projections use players’ previous two years usages and production (NFL Plus/Minus metric) to project out the next year. We could project over multiple seasons and adjust for the length of contract, but realistically most free agent signings only have a substantial positive impact for a single season, and most contracts are structured to allow teams to release players after one year.
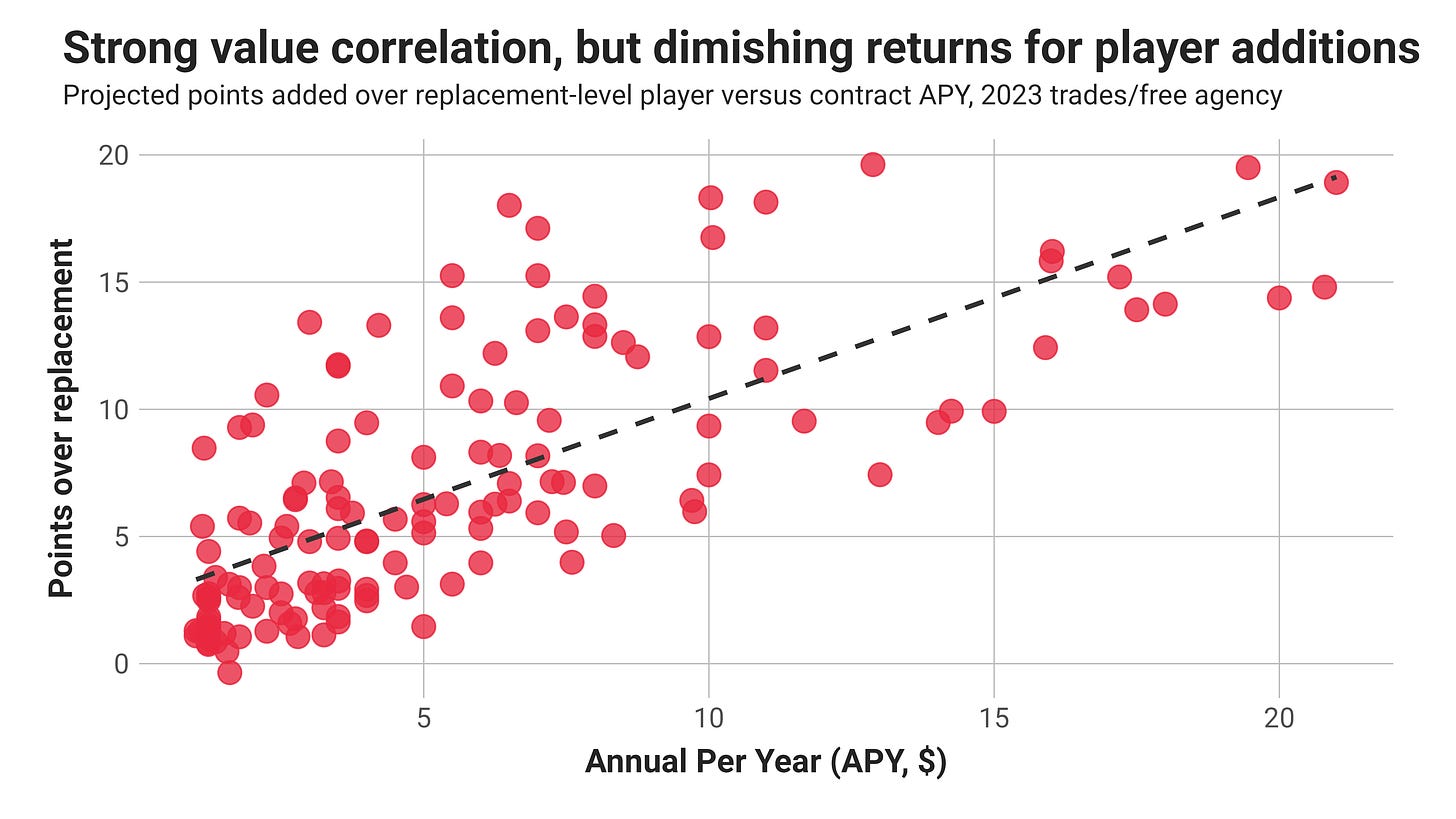
Grouping together all of the acquired players this offseason, we can see that there is a strong correlation between contract amounts in annual per year (APY) and my projected points over replacement. The slope of the curve is also less than one, meaning there are diminishing returns for each subsequent dollar spent for individual acquisitions. On average, a $5 million APY signing brings around 6.5 points over replacement, but moving up to $15 million of $20 million APY equates to less than the equivalent points.
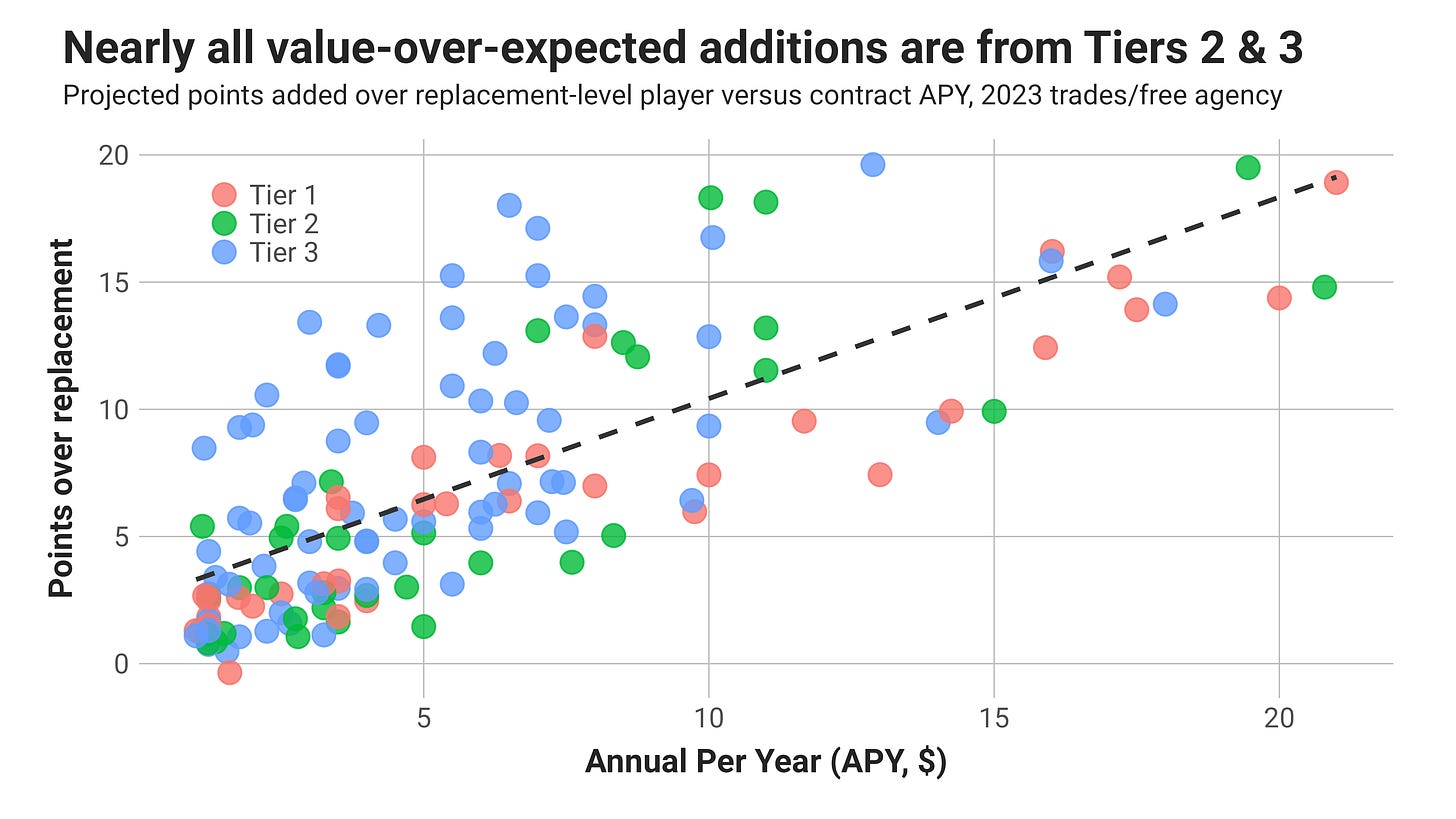
A big part of what makes a good free agent signing isn’t the characteristics of the individual players as much as the dynamics of the market by position. As we found in pre-free agency research, certain offensive and defensive positions have stronger talent available in free agency. Those values align with what I labeled as “Tier 3” positions according to my surplus value draft curves: interior offensive line, linebacker, running back, tight end and safety.
Identifying the draft value position tiers as different colors in the plot (1: offensive tackle, interior defensive line, and edge rusher; 2: cornerback and wide receiver, 3: interior offensive line, linebacker, running back, tight end and safety), we see that the majority of acquisitions with above contract expectation value were from Tier 3, and early all of the rest from Tier 2. The highest value non-quarterback positions you can find in the draft are the hardest to sign at a value in free agency, or acquire via trade.
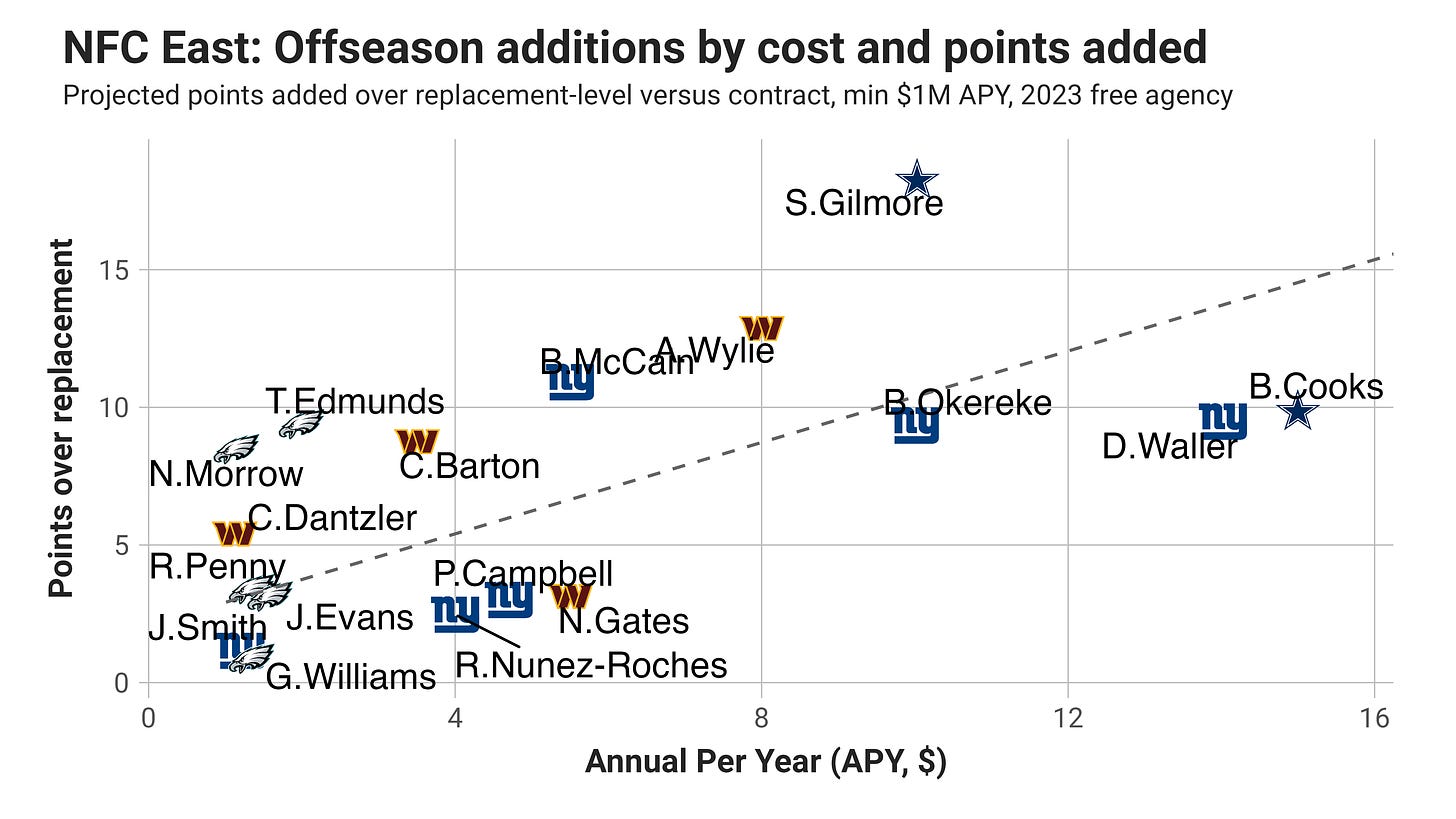
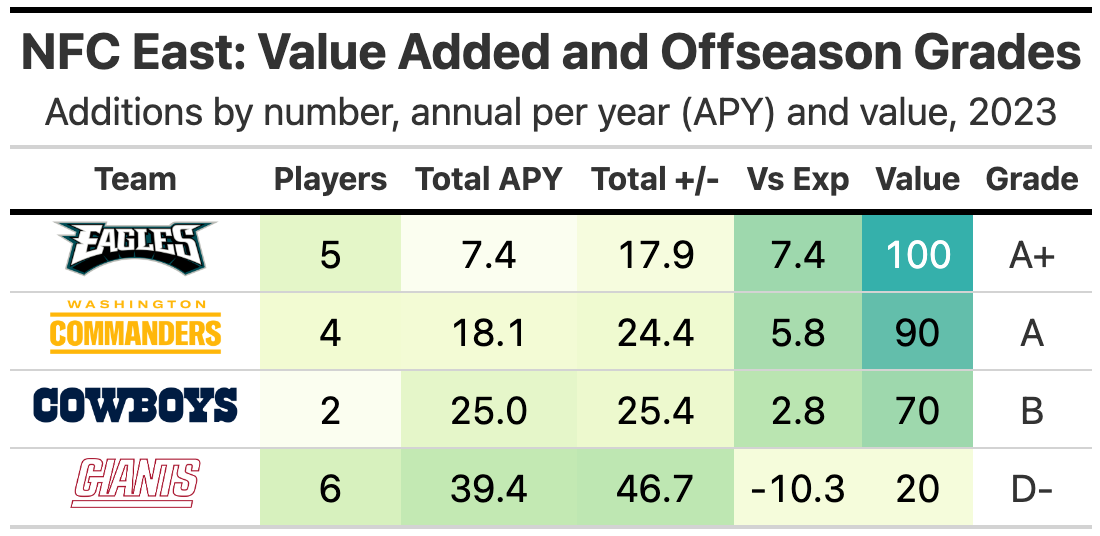
For each NFC division, I’m going to display a plot of every acquired player by APY cost and points over replacement benefit, then aggregate the team totals for those acquisitions by APY spent (Total APY), points over replacement gained (Total +/-), points over/under contract expectation (Vs Exp), the team percentile for points over expectation per dollar spent (Value), and the team’s grade based on that percentile. I divided the percentile spectrum (0-100) to make the grade allocations an even distribution.
Only players with a 2023 APY over at least $1 million are included in the numbers, and a handful of players are missing due to the lack of contract information available at the time this was written.
NFC EAST: EAGLES, COWBOYS, GIANTS & COMMANDERS
The Giants were, by far, the biggest spenders in the divisions, and also are adding the most points over replacement. But my projections don’t see those signings and trades as strong value, in particular in the case of Darren Waller. As a player entering his age-31 season, my projection doesn’t see him improving substantially from his subdued form from 2021 and 2022. This could be a blind spot of the projections only looking back two years, as his production according to my NFL Plus/Minus metric totaled almost 35 points in 2019-2020 before falling to 8.3 points in 2021-2022.
The Cowboys acquired two older veterans players by trade, and the projections like the addition of Stephon Gilmore much more than Brandin Cooks. Cooks is a bounce-back candidate after posting his lowest NFL Plus/Minus (9.1 points) last year since his rookie season in 2014.
The Commanders acquisitions are projected as mostly hits according to cost, especially for offensive tackle Andrew Wylie. The former Chiefs right tackle had the 33rd higher NFL Plus/Minus in 2022 (15.4 points), and rejoins Eric Bienemy in Washington. At a little over $8 million APY, Wylie will be a steal with anything resembling his previous performance.
The Eagles lost seven 2022 starters in free agency this offseason, plus a couple players who could have played material roles this year. Without a lot of cap space to work with, Howie Roseman worked what magic he could, bringing in the highest value per APY of any team. None of the Eagles signing were for more than $2 million APY, which is a higher value cohort, but lacking elite upside.
NFC WEST: 49ERS, SEAHAWKS, RAMS & CARDINALS
Keep reading with a 7-day free trial
Subscribe to Unexpected Points to keep reading this post and get 7 days of free access to the full post archives.


