Adjusted Quarterback Efficiency 2.0
Mahomes the undisputed champ, Dak falls down, Trevor a top-5 QB?
Last week I introduced the 1.0 version of adjusted quarterback efficiency (AQE), which combined EPA metrics from nflfastR with charting data from FTNData. I used those data sources and predictive modeling to quantify adjustments to traditional expected points added (EPA) per play, specifically for the following factors:
Drops
Interception-worthy throws
Sack prevention from blocking
Strength-of-schedule
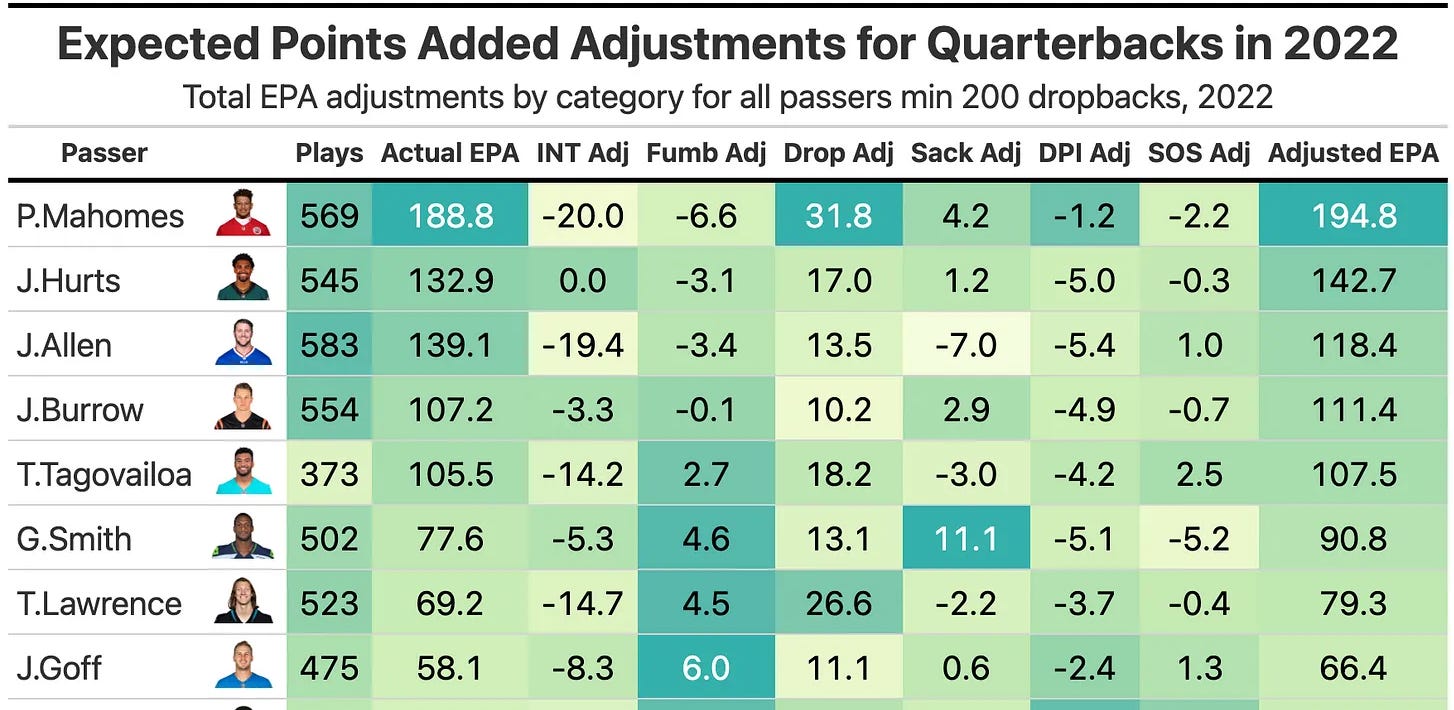
Here’s a sampling of the results for top quarterbacks in version 1.0:
I think the final numbers did a better job of isolating quarterback play than unadjusted EPA per play, but there were still ways to improve the methodology.
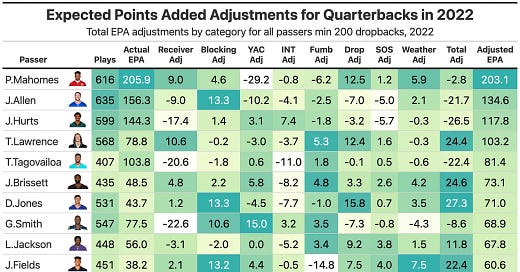
This week, I’m revealing a new and improved AQE, the 2.0 version. This version does a better job of quantifying the value gained or lost through the factors present in version 1.0, plus adds a number of new factors to the adjustments, including:
Receiver value (ability to get open)
Scheme and receiver affects on yards-after-catch
Weather adjustments
Adding pressure prevention to sack prevention
Improving AQE 1.0
One of the flaws I quickly noticed after publishing the 1.0 version was the unidirectional nature of the drop and interception-worthy pass adjustments. Rather than simply adding EPA back to quarterbacks based on drops and subtracting them for interception-worthy throws, I realized I needed to apply an expected value framework, using charting location data to contrast how the actual results for drop and interception rates differed from what we’d expect. Some quarterbacks should be helped and other hurt by drop variance, the same with interception-worthy plays.
The foundation of these adjustments, and many of the new factors being added, is a series of expected EPA numbers for different throw outcomes, based on charted target locations, and if catches were contested or interception-worthy. I calculated four expected EPA numbers for every throw:
Expected drop rate
Expected air-yards EPA gain (assuming pass was completed)
Expected yard-after-catch EPA gain
Expected incompletion EPA lost
Expected interception EPA lost
With those numbers, we can translate the value of any throw into its counterfactuals. How much EPA would have been generated if a dropped pass was caught? How much EPA would have been lost if an interception-worthy throw wasn’t dropped by the defender?
Improving the drop and interception adjustments
The 2.0 version of AQE enhances the drop adjustments by adding an assumed drop rate for each throw based on target location and if the catch was contested. A quarterback could get a positive adjustment if their drop rate was higher than expected (Aaron Rodgers), or a negative adjustment if their receivers were better than expected at reeling in passes (Joe Burrow).
A similar principle applies to plays graded as turnover-worthy, which are now all expected to be intercepted at a league-average rate (roughly 35%). A quarterback whose interception-worthy passes are picked off at a higher rate has his efficiency adjusted up, and those at a lower rate are adjusted down.
Interception run-backs are also adjusted to expectation based on target location, so an unlucky pick-6 runback on a throw down the field doesn’t have as much of an impact on quarterback EPA as shorter throws to the outside, which are more often taken to the house. Lastly, interceptions that were not tracked as turnover-worthy are adjusted to the expected EPA loss for incompletions, instead of huge negatives that comes with turnovers and runbacks.
Adding receiver value
It’s difficult to gauge receiver value on the field. Production is a signal in itself, but is also attached to quarterback, making it a poor adjustment to isolate quarterback play. PFF grades the receiver when targeted, but route-based grading isn’t publicly available. Receivers can have an effect on quarterback efficiency even if they’re not targeted, either drawing tougher cornerback assignments or getting shaded coverages.
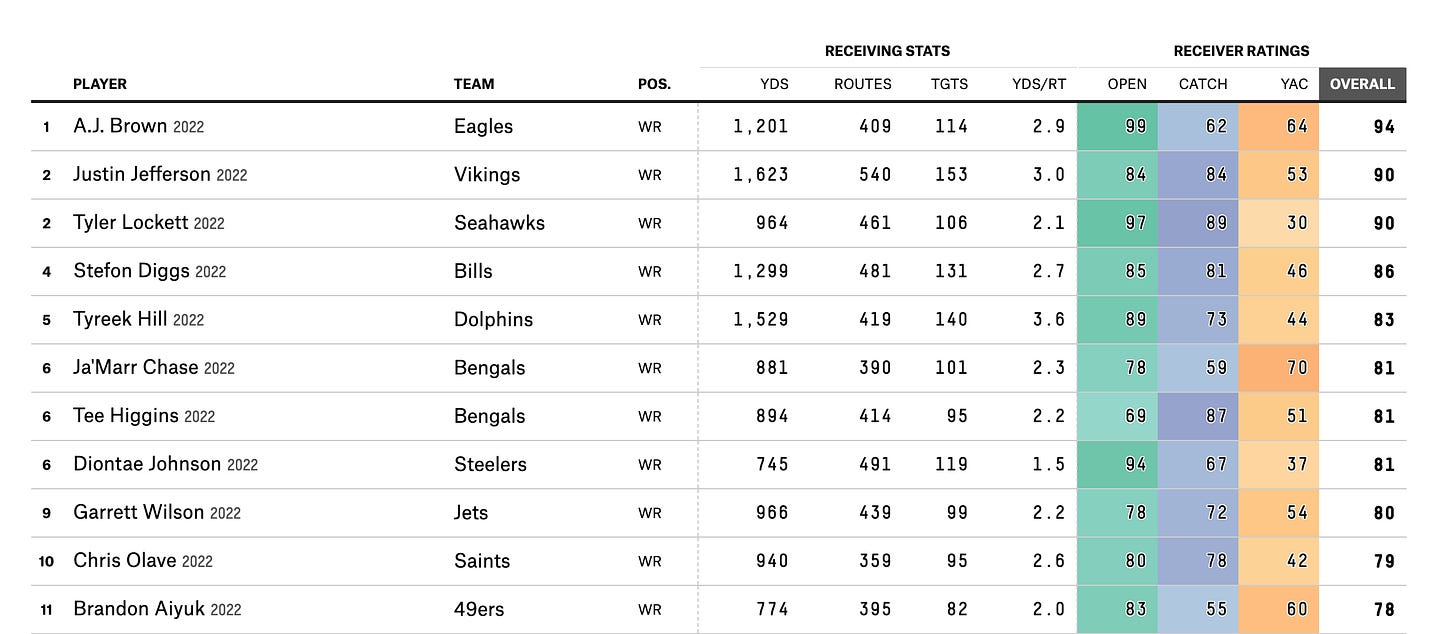
ESPN created its own receiver ratings, broken into three factors that aggregate up into an overall ranking: open rating, catch rating and YAC rating. I’m only using the open rating for AQE to prevent double-counting: I’m already making adjustments for drops and contested catches (big drivers of catch rating), and later I’ll detail adjustments for YAC over expectation
I used a series of regression models to calculate the expected air-yards per route for receivers based on their open ratings, then combined play-by-play route participation data from FTNData to find the total expected air yards per route for all the receivers on the field. I assume a 10th percentile efficiency for receivers who don’t make the 40-target threshold for ESPN’s ratings (20-target threshold for running backs), and I double the weighting of the targeted receiver, assuming the “openness” of the targeted receiver is most important for quarterback efficiency.
All this allowed me to derive an expected air-yard EPA based on the receivers a quarterback has on the field, and see if that quarterback’s actual air-yard EPA is above or below that exception.
Adding scheme/YAC value
One of the variables provided by nflfastR is “xyac_epa”, or expected YAC EPA for a throw based on location. It does a good job of estimate YAC based on air yards and target location, but I think I was able to enhance it slightly with the charting data from FTNData. I took my expected YAC EPA data and compared it to actual YAC EPA for each quarterback.
I’m assuming a quarterback’s YAC EPA is higher than the expected primarily due to two factors: the receiver is schemed open, or the receiver is able to generate additional YAC through elusiveness and broken tackles. I was able to incorporate broken-tackle YAC into the formula, but the schemed-open part is more based on my interpretation.
Excess YAC could be schemed open receivers, or driven by quarterback who knows how to find the most open receiver, or a combination of both. I think we eliminate most of the double-counting with ESPN’s open rating above because that metric attempts to account for scheme in the equation, isolating how the receiver influenced his openness.
I’m fairly confident the primary driver of excess YAC EPA is scheme because the teams leading in that category (Chiefs and 49ers) are known to have coaches who can scheme up open receivers.
Adding pressures to sacks for blocking adjustment
In AQE 1.0, I used the play-by-play pressure data from FTNData to build survival curves for each quarterback based on his pass blocking, then calculated how many sacks would have been expected with the given pass-play attributes (time-to-throw, down, field position, play action). From this, we can determine the expected sack rate due to the pressure, and how it compares to what we expected from the play attributes. That credit/debit is given to blocking, which means it was taken away from, or given to, the quarterback.
But there’s a significant effect of quarterback efficiency from pass blocking that doesn’t come in the form of sacks. Pressure, in and of itself, generally hurts quarterback efficiency. EPA on pressured throws is more than half a point lower than those from a clean pocket, so we need to account how good or bad protection affects sacks and pressures to have an accurate account of total blocking value.
I used the pressure survival curves to do just that, and adjusted quarterback performance for quarterbacks based on the pressure they faced above or below scheme expectations. One adjustment I made to that assumption was credit quarterback who are able to neutralize pressure through mobility. I quantified that by looking at quarterbacks’ rate of pressures that turn into positive yardage scrambles.
Bringing it all together
If you’re still awake (or maybe you skipped right here. Smart move) I’ll now display and walk through the results from the adjusted detailed above, and what they say about more isolated quarterback efficiency this season. Here’s is AQE 2.0:
Keep reading with a 7-day free trial
Subscribe to Unexpected Points to keep reading this post and get 7 days of free access to the full post archives.


